|
Valori estremi del mese corrente |
Grafici meteo riferiti a , |
||
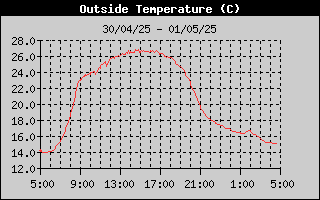
Temperatura max Temperatura min |
36.8░C 22.3░C |
|
|
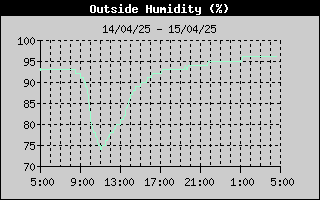
UmiditÓ max UmiditÓ min |
67% 27 % |
||
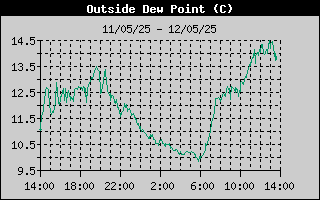
Dewpoint max Dewpoint min |
20.6░C 13.9░C |
||
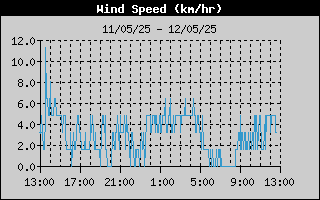
VelocitÓ del vento max |
0.0 km/hr |
||
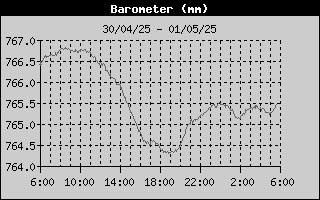
Pressione equiv. s.l.m. max Pressione equiv. s.l.m. min |
764.2 mm 760.7 mm |
||
Pioggia totale |
0.0 mm |
||
IntensitÓ pioggia max |
0.0 mm/hr |
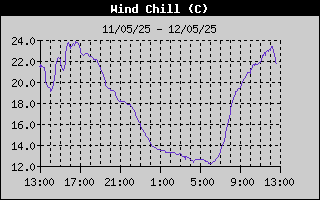
Wind Chill Min |
22.2░C |
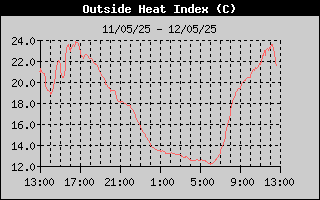
Indice di calore max |
41.1░C |
||
|
Valori estremi dell'anno corrente |
|||
Temperatura max Temperatura min |
37.2░C -2.7░C |
||
UmiditÓ max UmiditÓ min |
98% 17 % |
||
Dewpoint max Dewpoint min |
24.4░C -9.4░C |
||
VelocitÓ del vento max |
40.2 km/hr |
||
Pressione equiv. s.l.m. max Pressione equiv. s.l.m. min |
779.6 mm 745.6 mm |
||
Pioggia totale |
1306.8 mm |
||
IntensitÓ pioggia max |
332.5 mm/hr |
||
Wind Chill Min |
-3.3░C |
||
Indice di calore max |
44.4░C |
||

